Economy
|
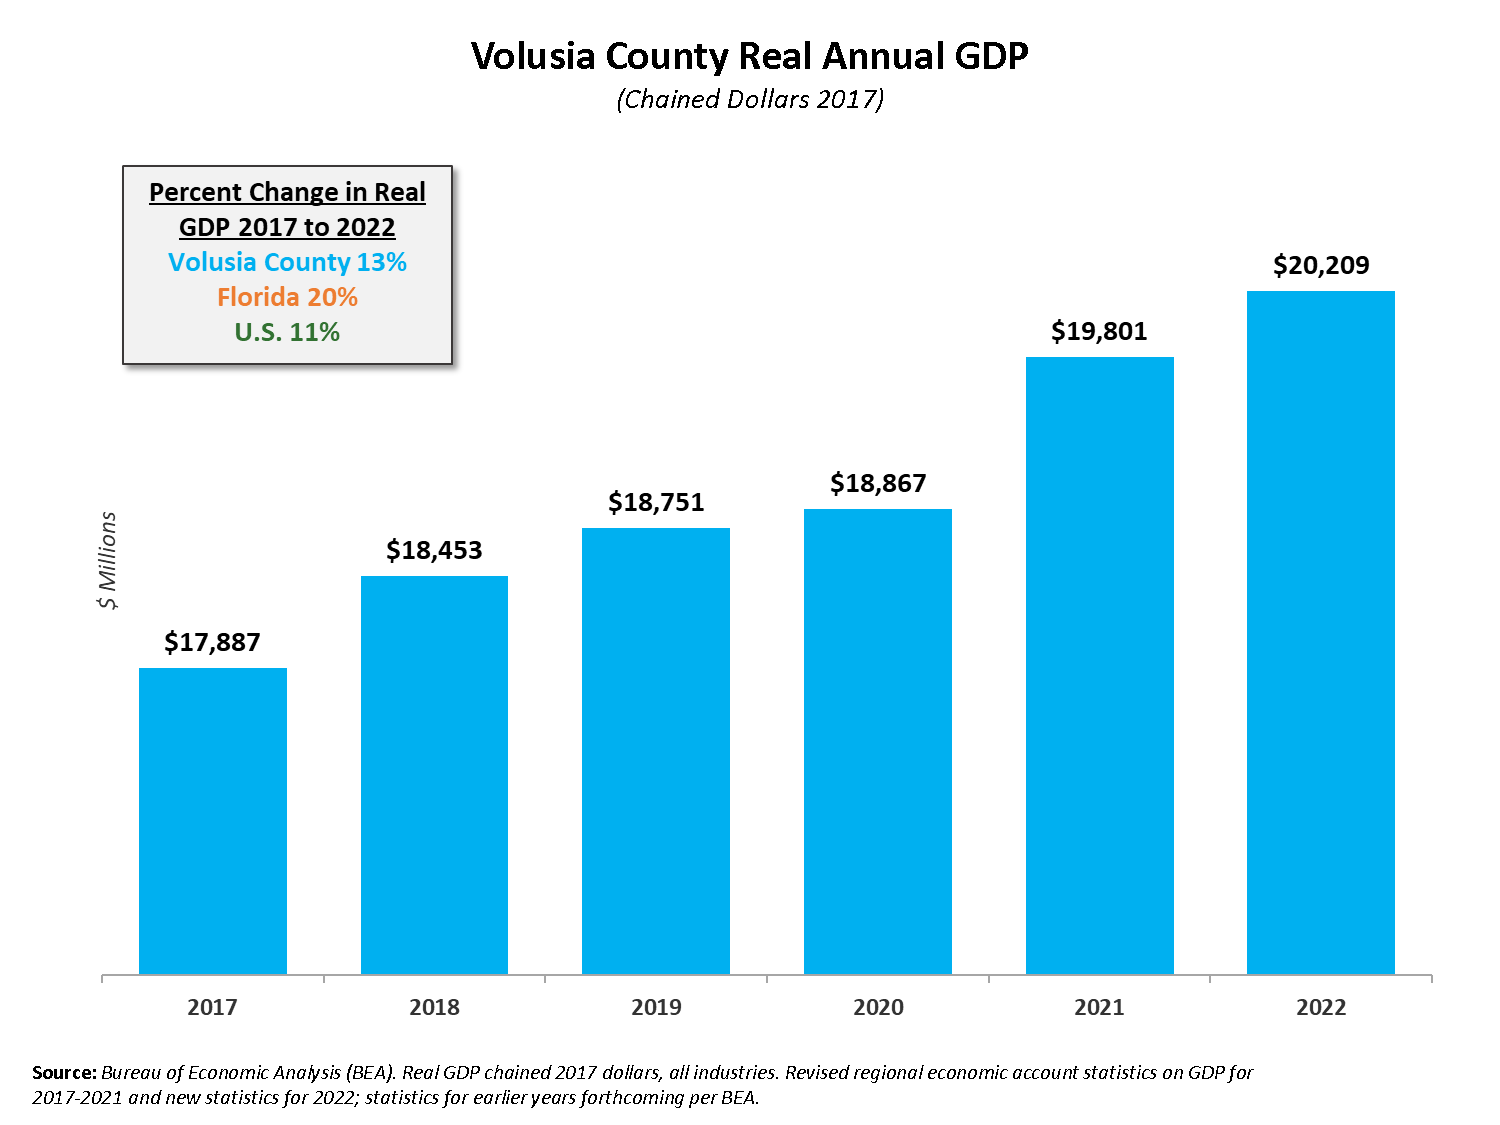
2022 Volusia County $20 Billion |
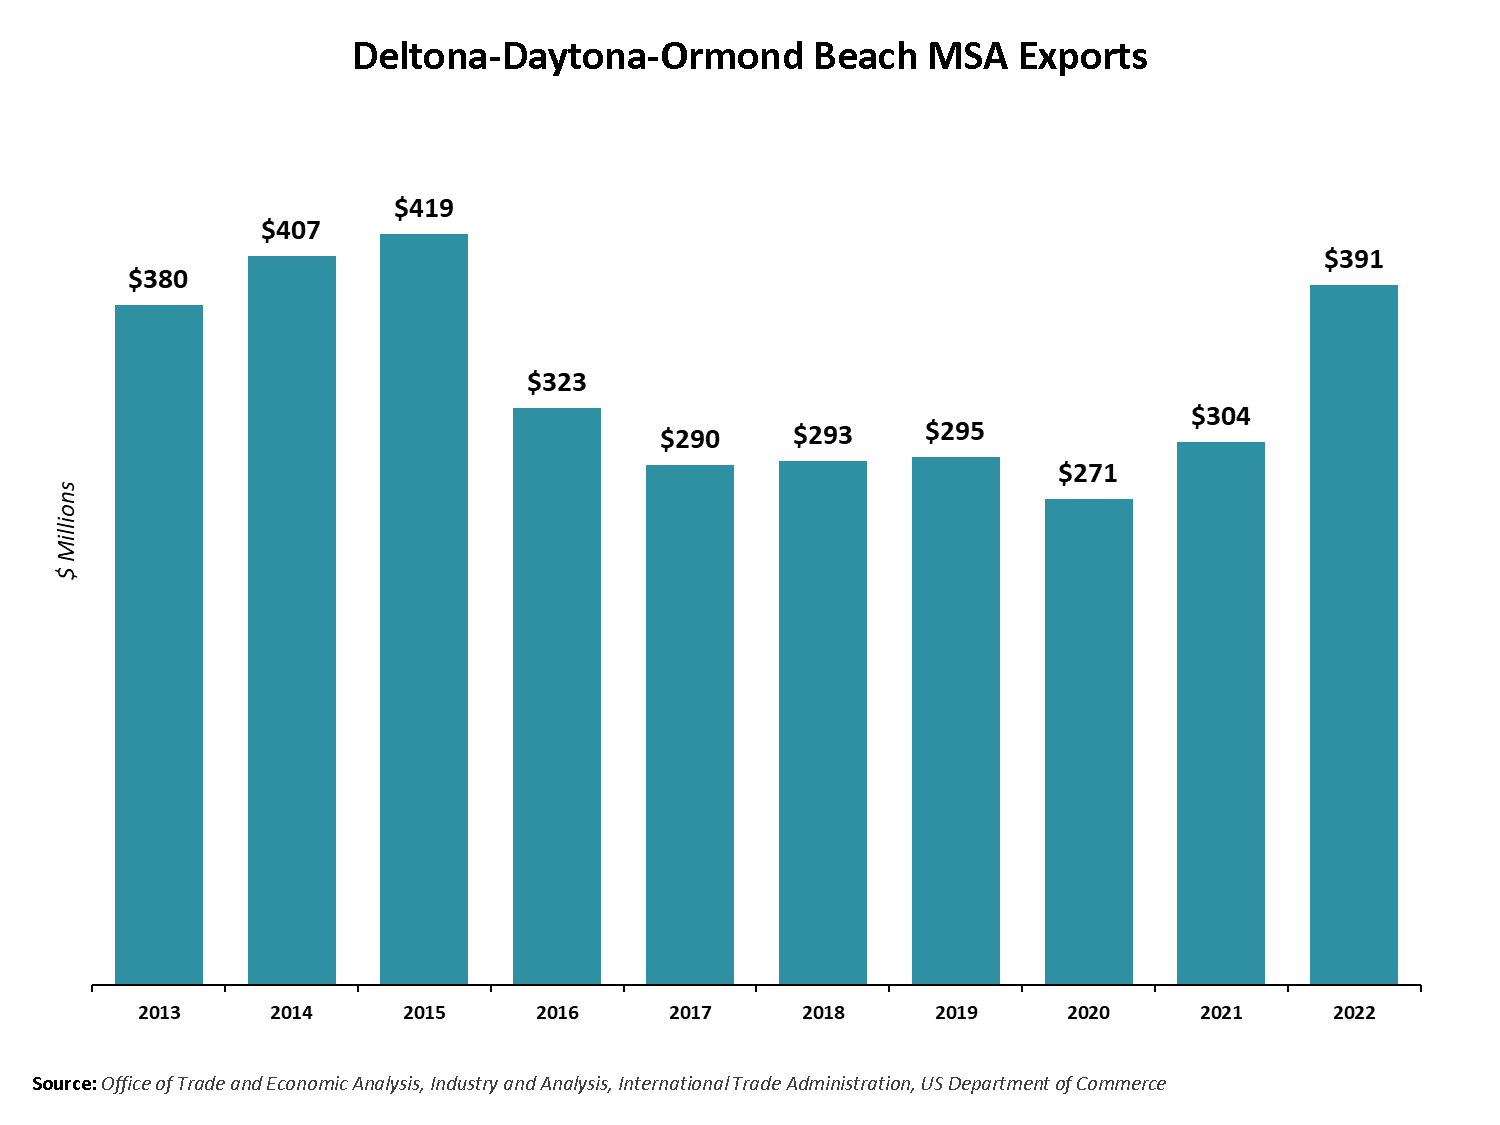
2022 Volusia County $391 Million |
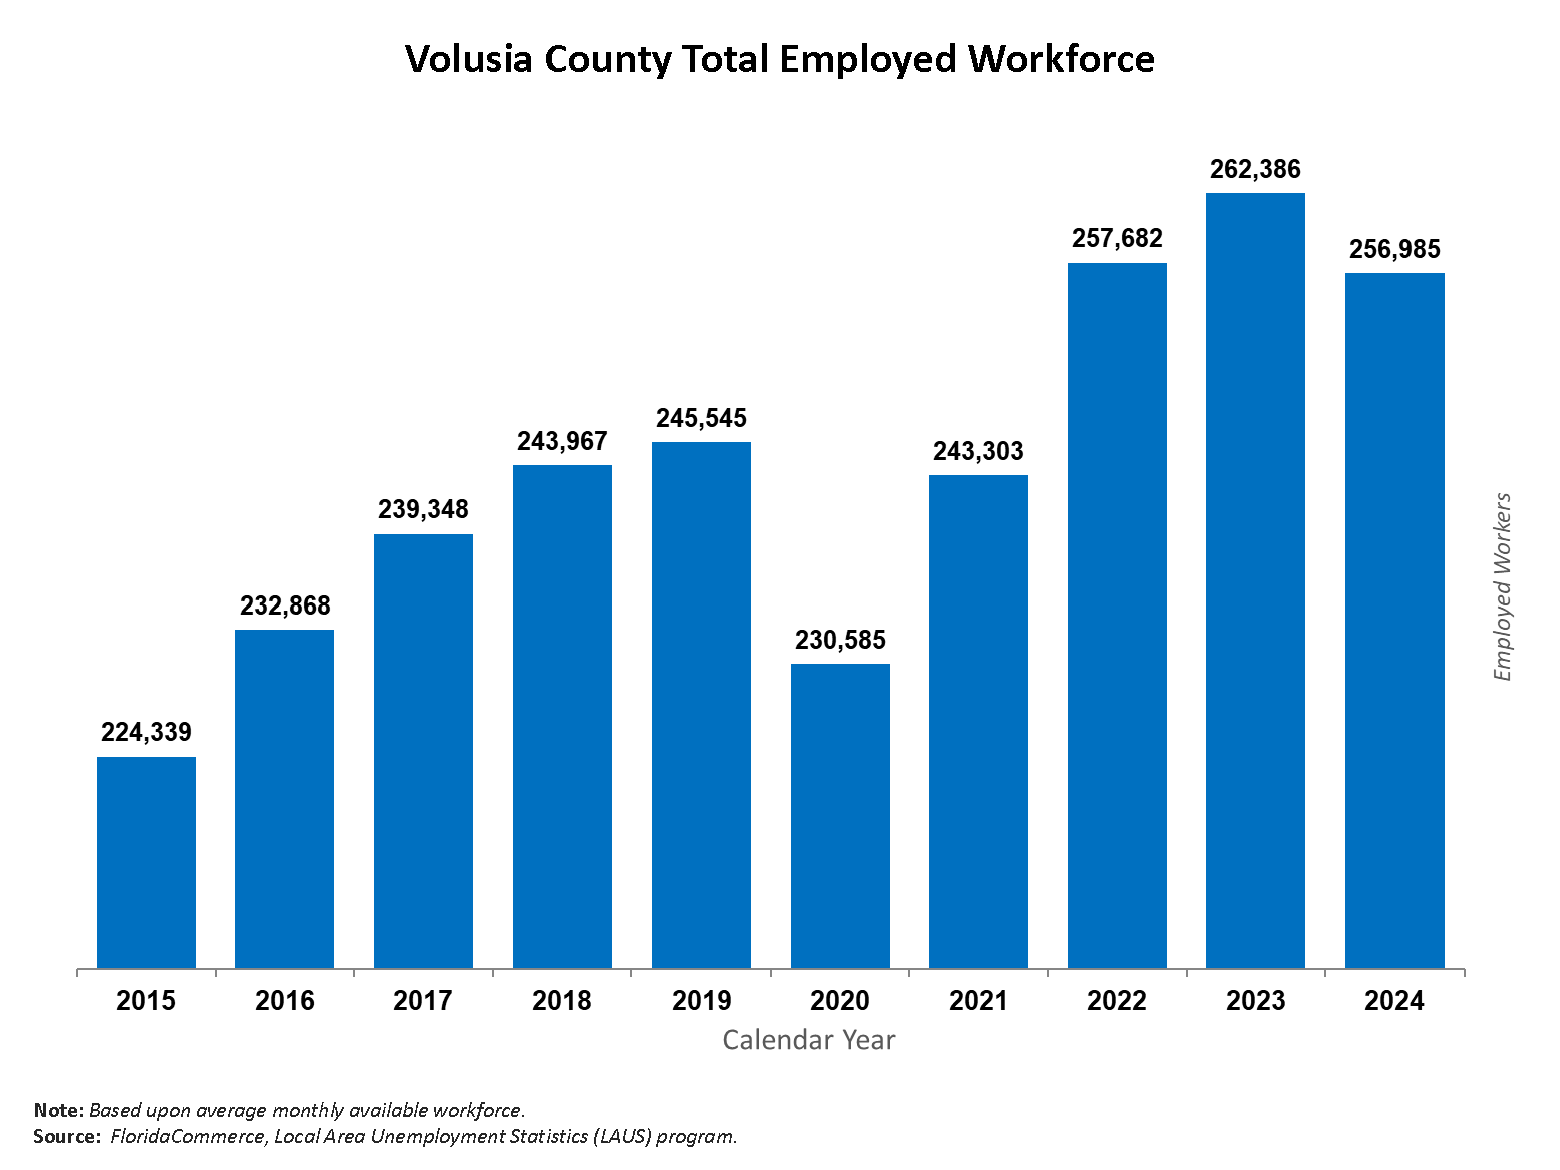
2023 Employed 262,170 |
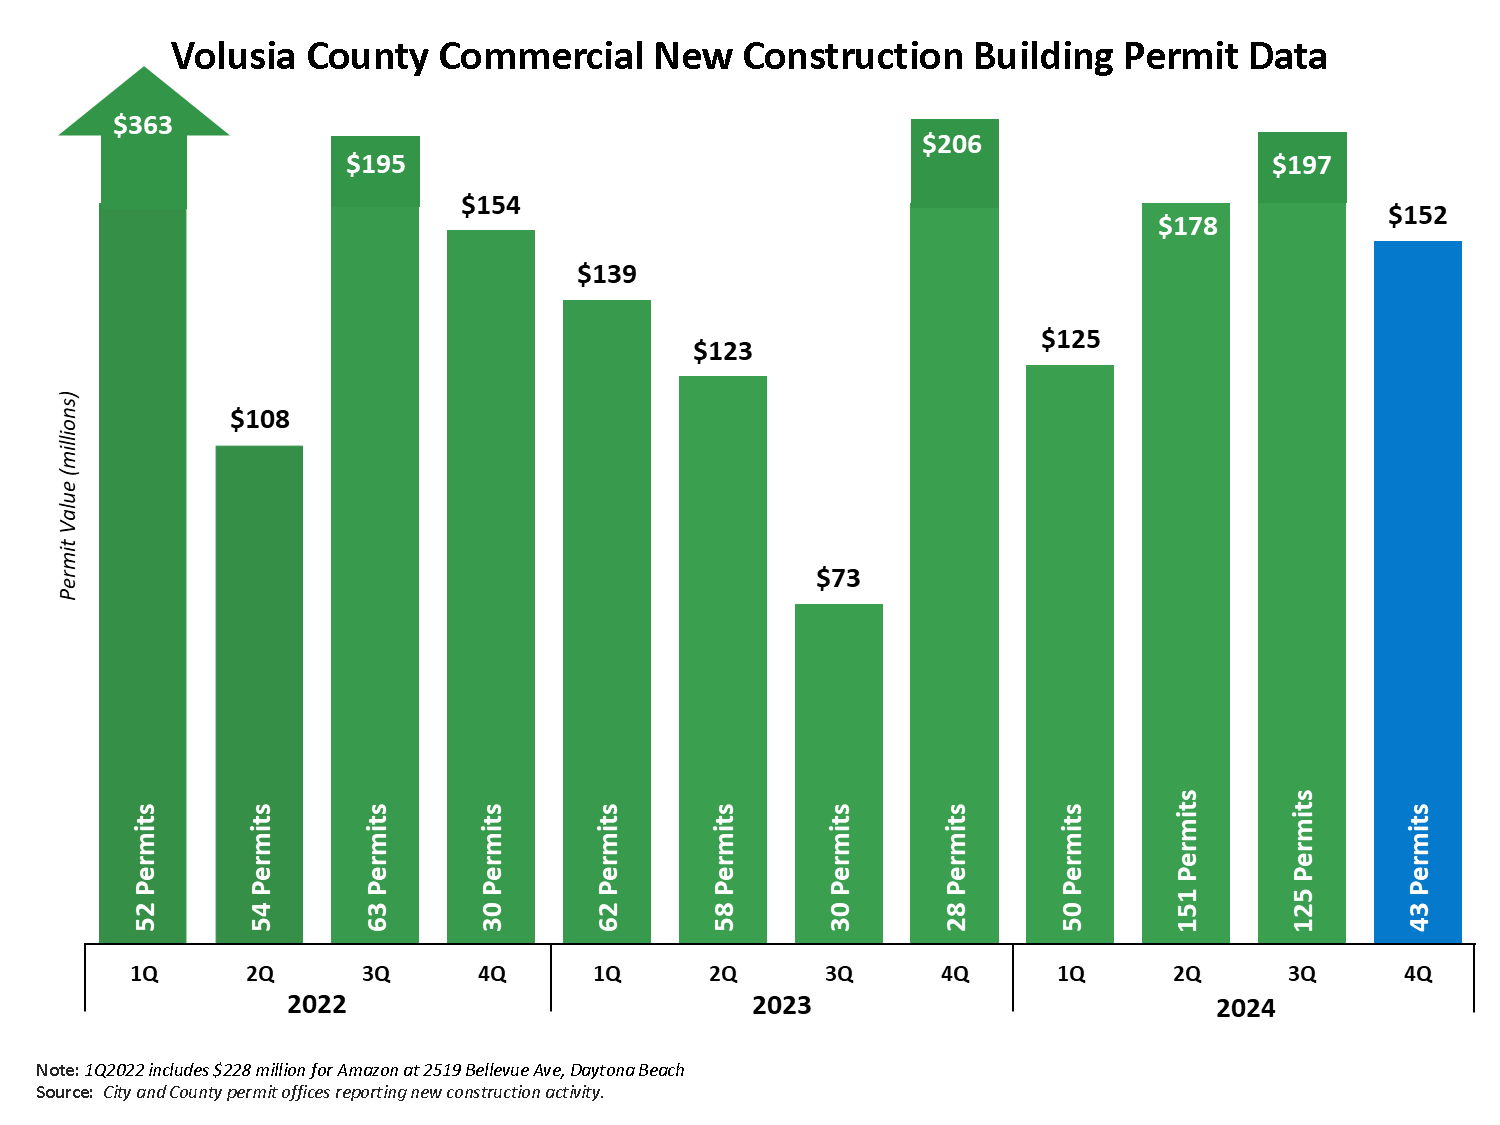
2024 New Commercial $663 Million |
2024 New Residential $1.22 Billion |
Quick Links:
- Annual GDP
- Export Trend
- Employment Trend
- Commercial Building Permits
- Residential Building Permits
- Residential Building Permit Trends
- Housing Values
- Residential Foreclosure Filings
Gross Domestic Product
Volusia County's strong GDP of $20 billion is ranked 14th out of 67 counties in Florida.
Exports
The Deltona-Daytona-Ormond MSA is ranked 10th out of 22 MSAs in Florida for exports. The top exports consist of Transportation Equipment, Machinery, Computer & Electronic Products, Electrical Equipment and Textile Mill Products respectively by value and make up 59% of the products exported.
Employment
Volusia County employment dropped 6% due to the COVID pandemic and has since recovered by 10%. View the most current labor statistics reported monthly.
Commercial Building Activity
For the 12 months ending December 2024, an average of $55.2 million per month in new ground up commercial building permits have been issued.
Residential Building Activity
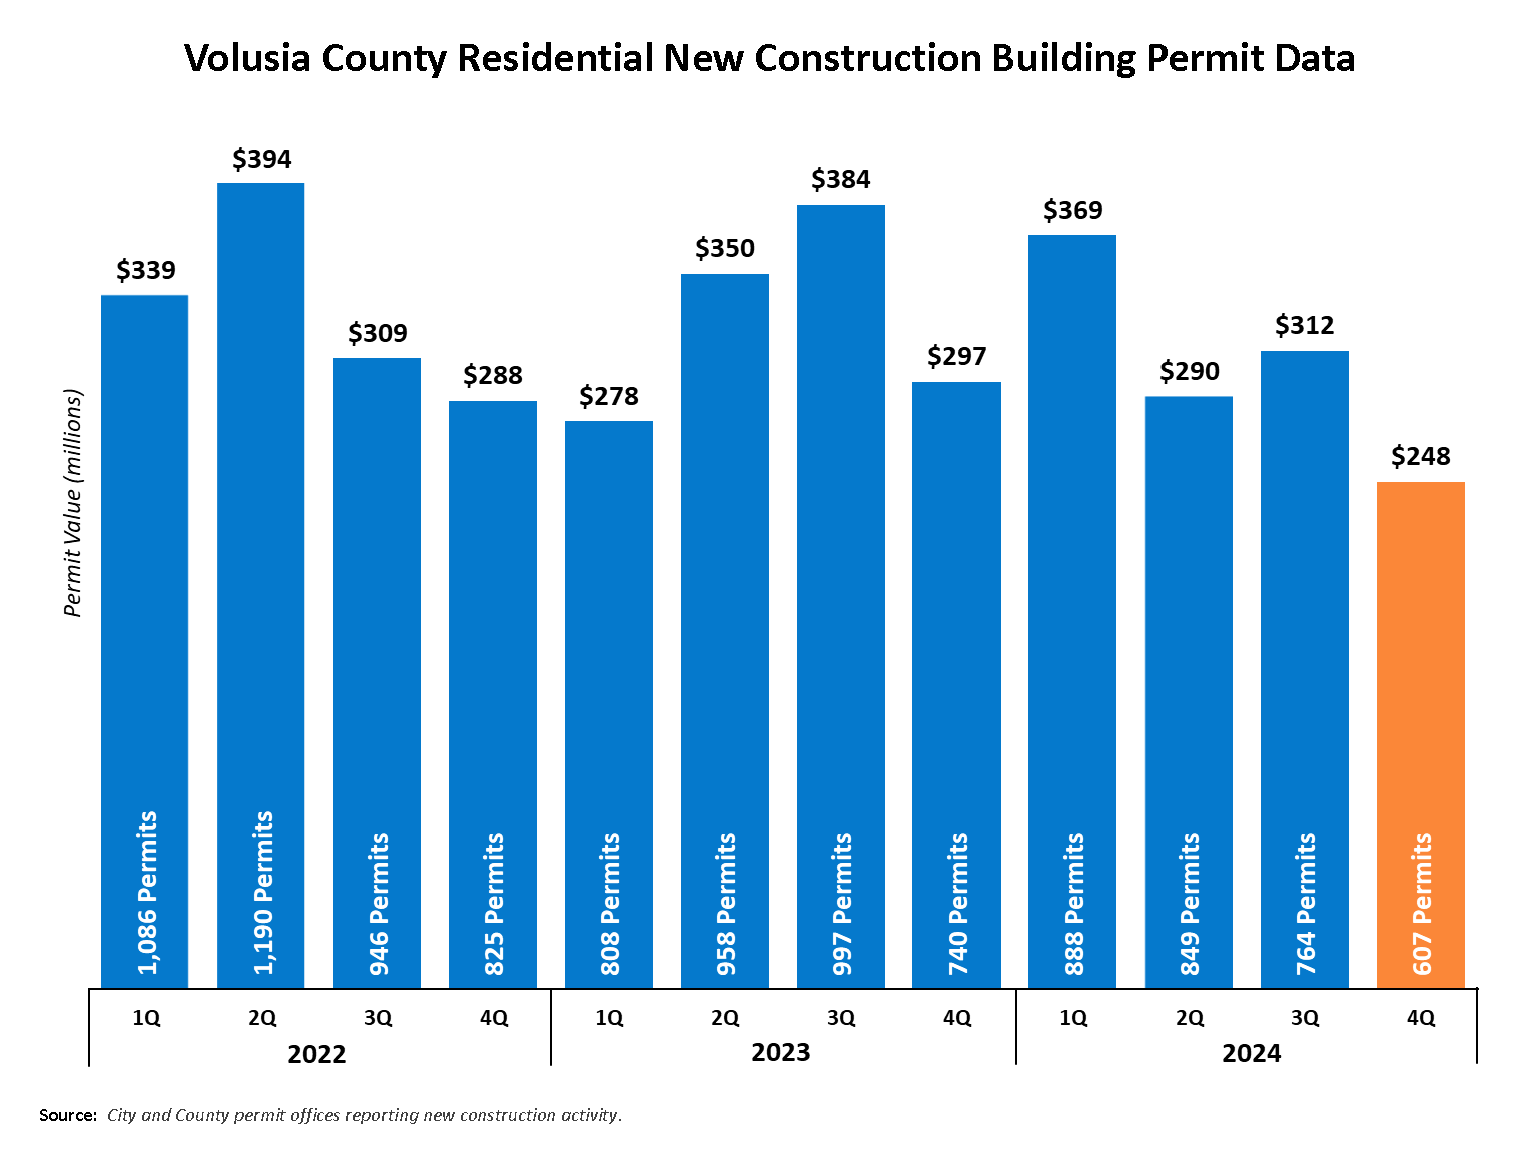
For the 12 months ending December 2024, an average of 259 new residential building permits have been issued per month. That's an average of $101.6 million per month in single family residential permits.
Residential Building Permit Trend
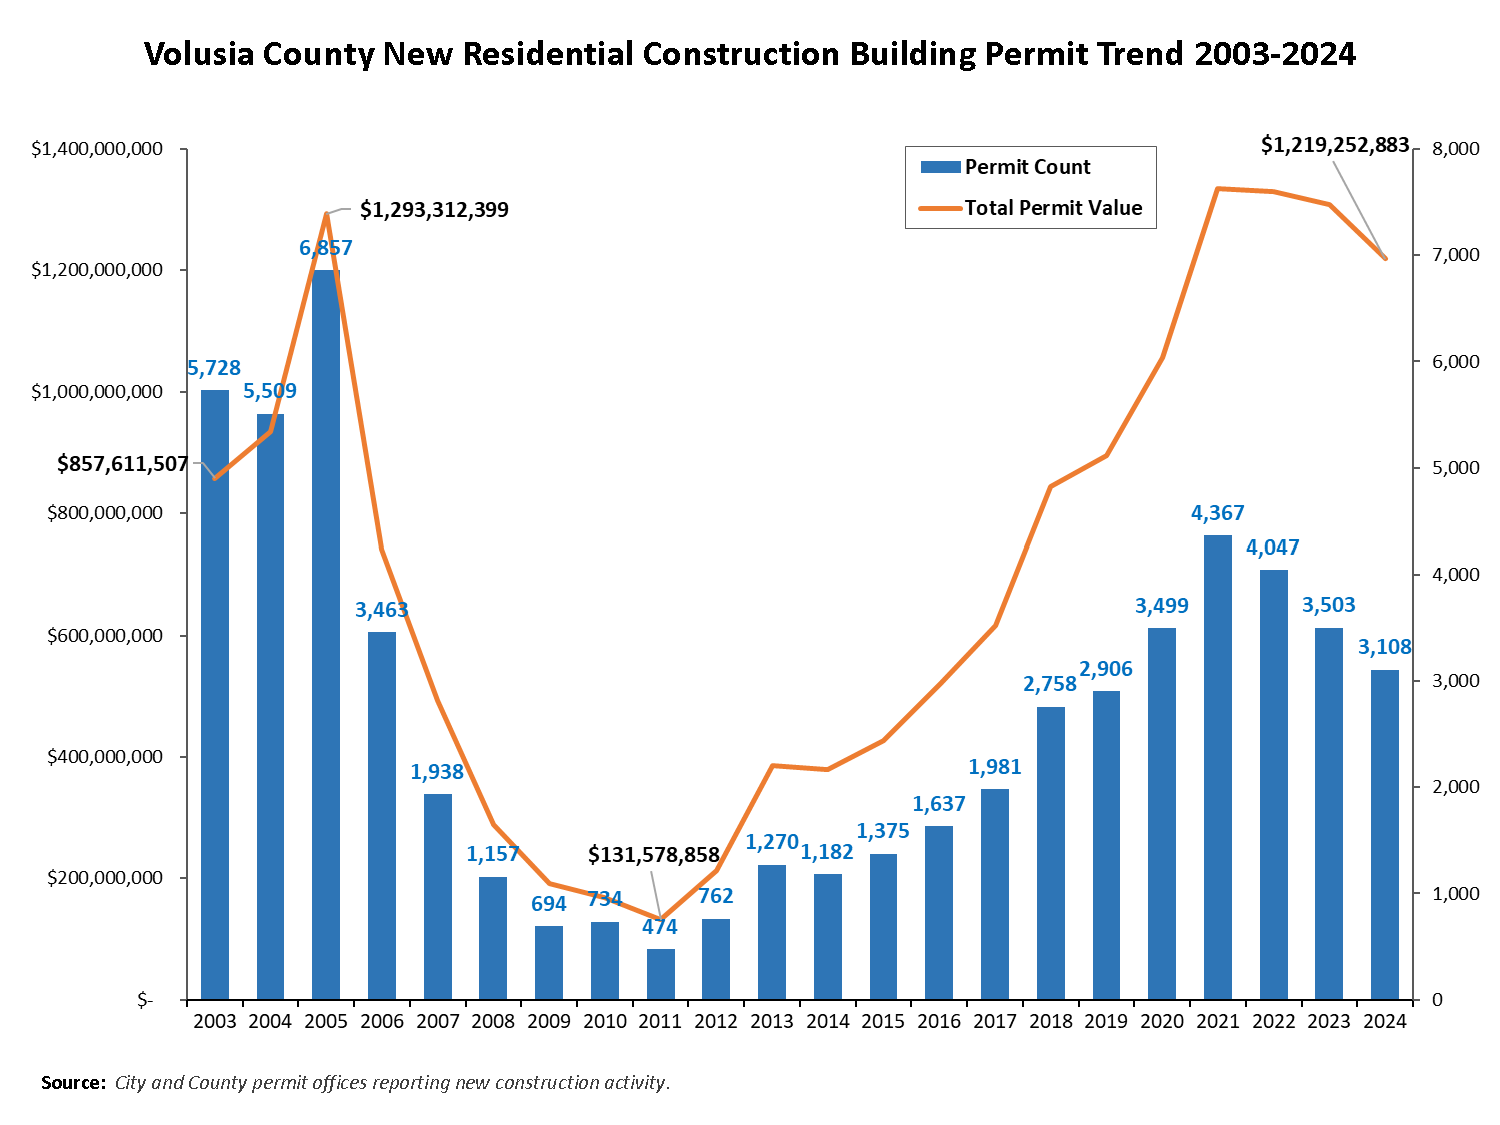
Residential building permit activity has increased steadily every year since 2012 with the average value of homes constructed in 2023 at $373,613 whereas values were $188,611 at the height of activity in 2005.
Housing Values
| Median Sale Price (Feb. 2025) | East Volusia | West Volusia |
|---|---|---|
| Single Family Homes | $359,000 | $335,000 |
| Townhouses & Condos | $289,900 | $227,500 |
Sources: Daytona Beach Area Realtors Associations, West Volusia Realtors Association
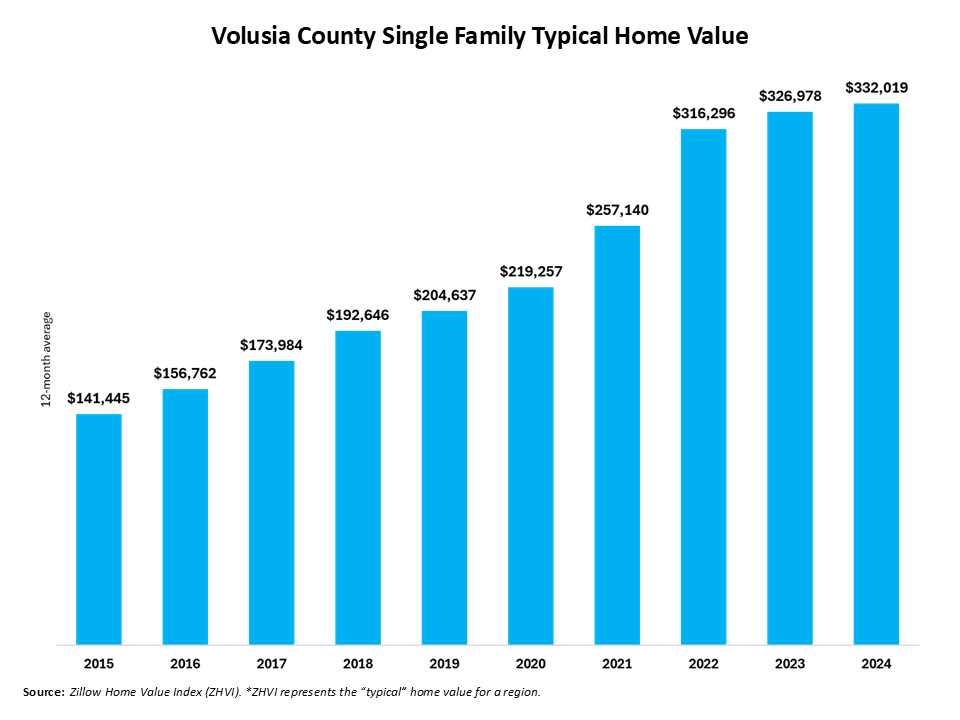
Source: Zillow Home Value Index
Residential Foreclosure Filings
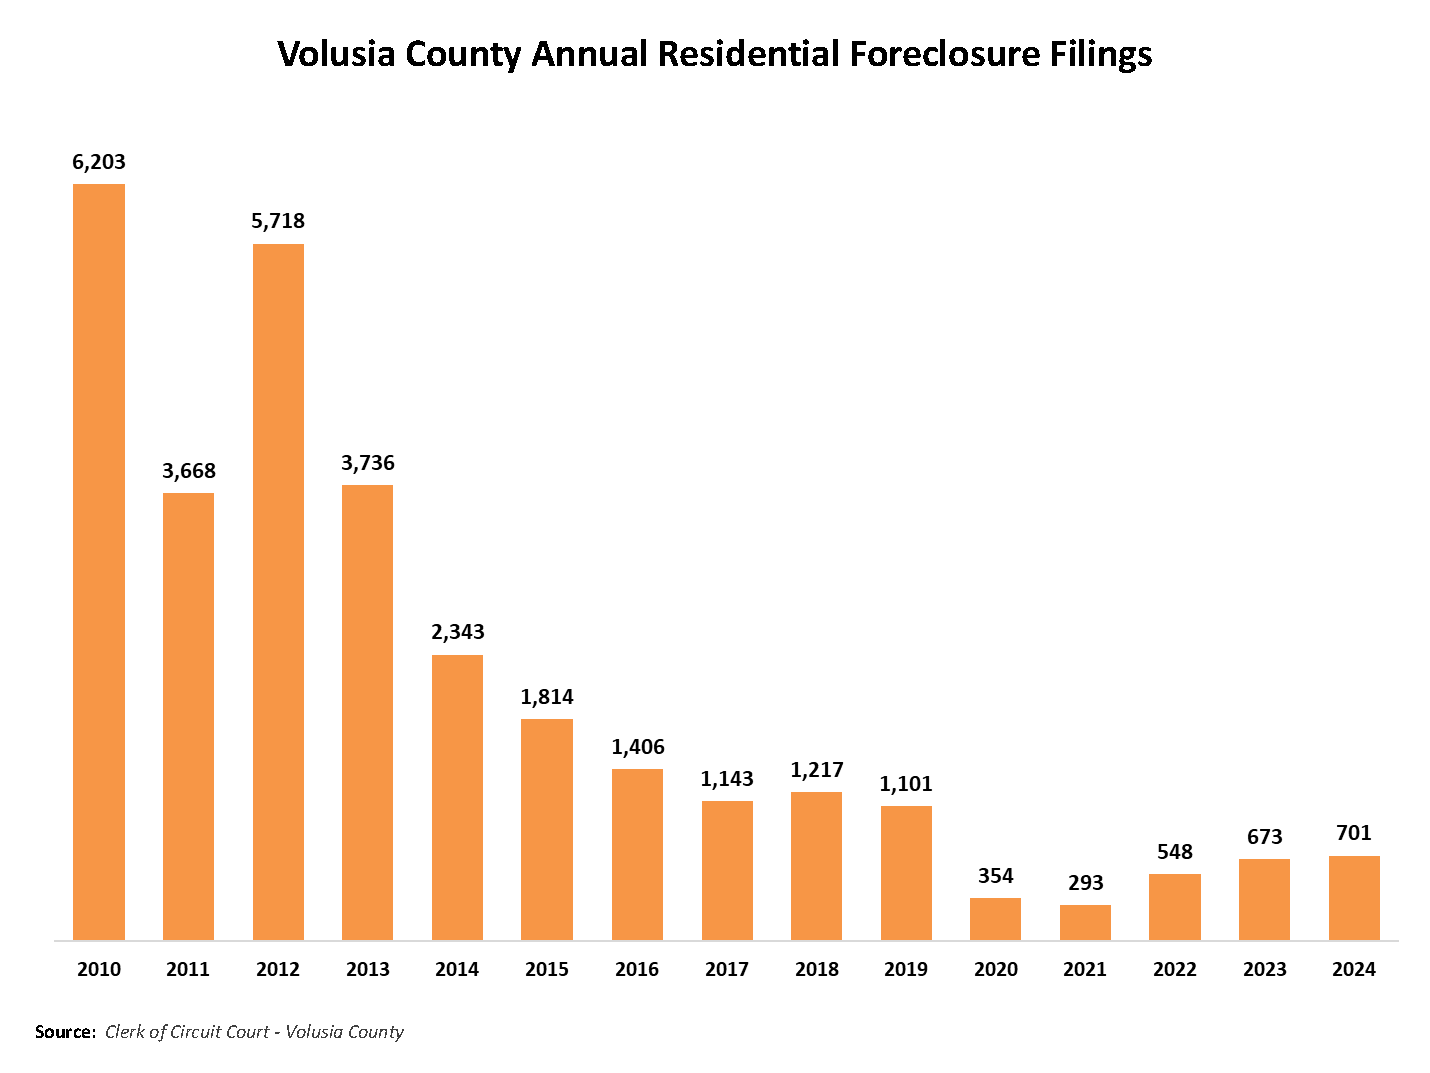
Volusia County has had a continuous downward trend of foreclosure filings since the peak in 2010.

