Workforce

March 2025 Preliminary Labor Statistics as of 4/18/2025

Volusia County
Workforce Size

268,083

Volusia County
Employed

257,477

Volusia County 
Unemployed

10,606

Volusia County
Unemployment Rate

4.0%

Source: U.S. Department of Labor, Bureau of Labor Statistics, Local Area Unemployment Statistics (LAUS)

The next release is scheduled on May 16, 2025 for March 2025 preliminary stats.

Quick Links:

Volusia County, Florida, U.S. Unemployment Trend
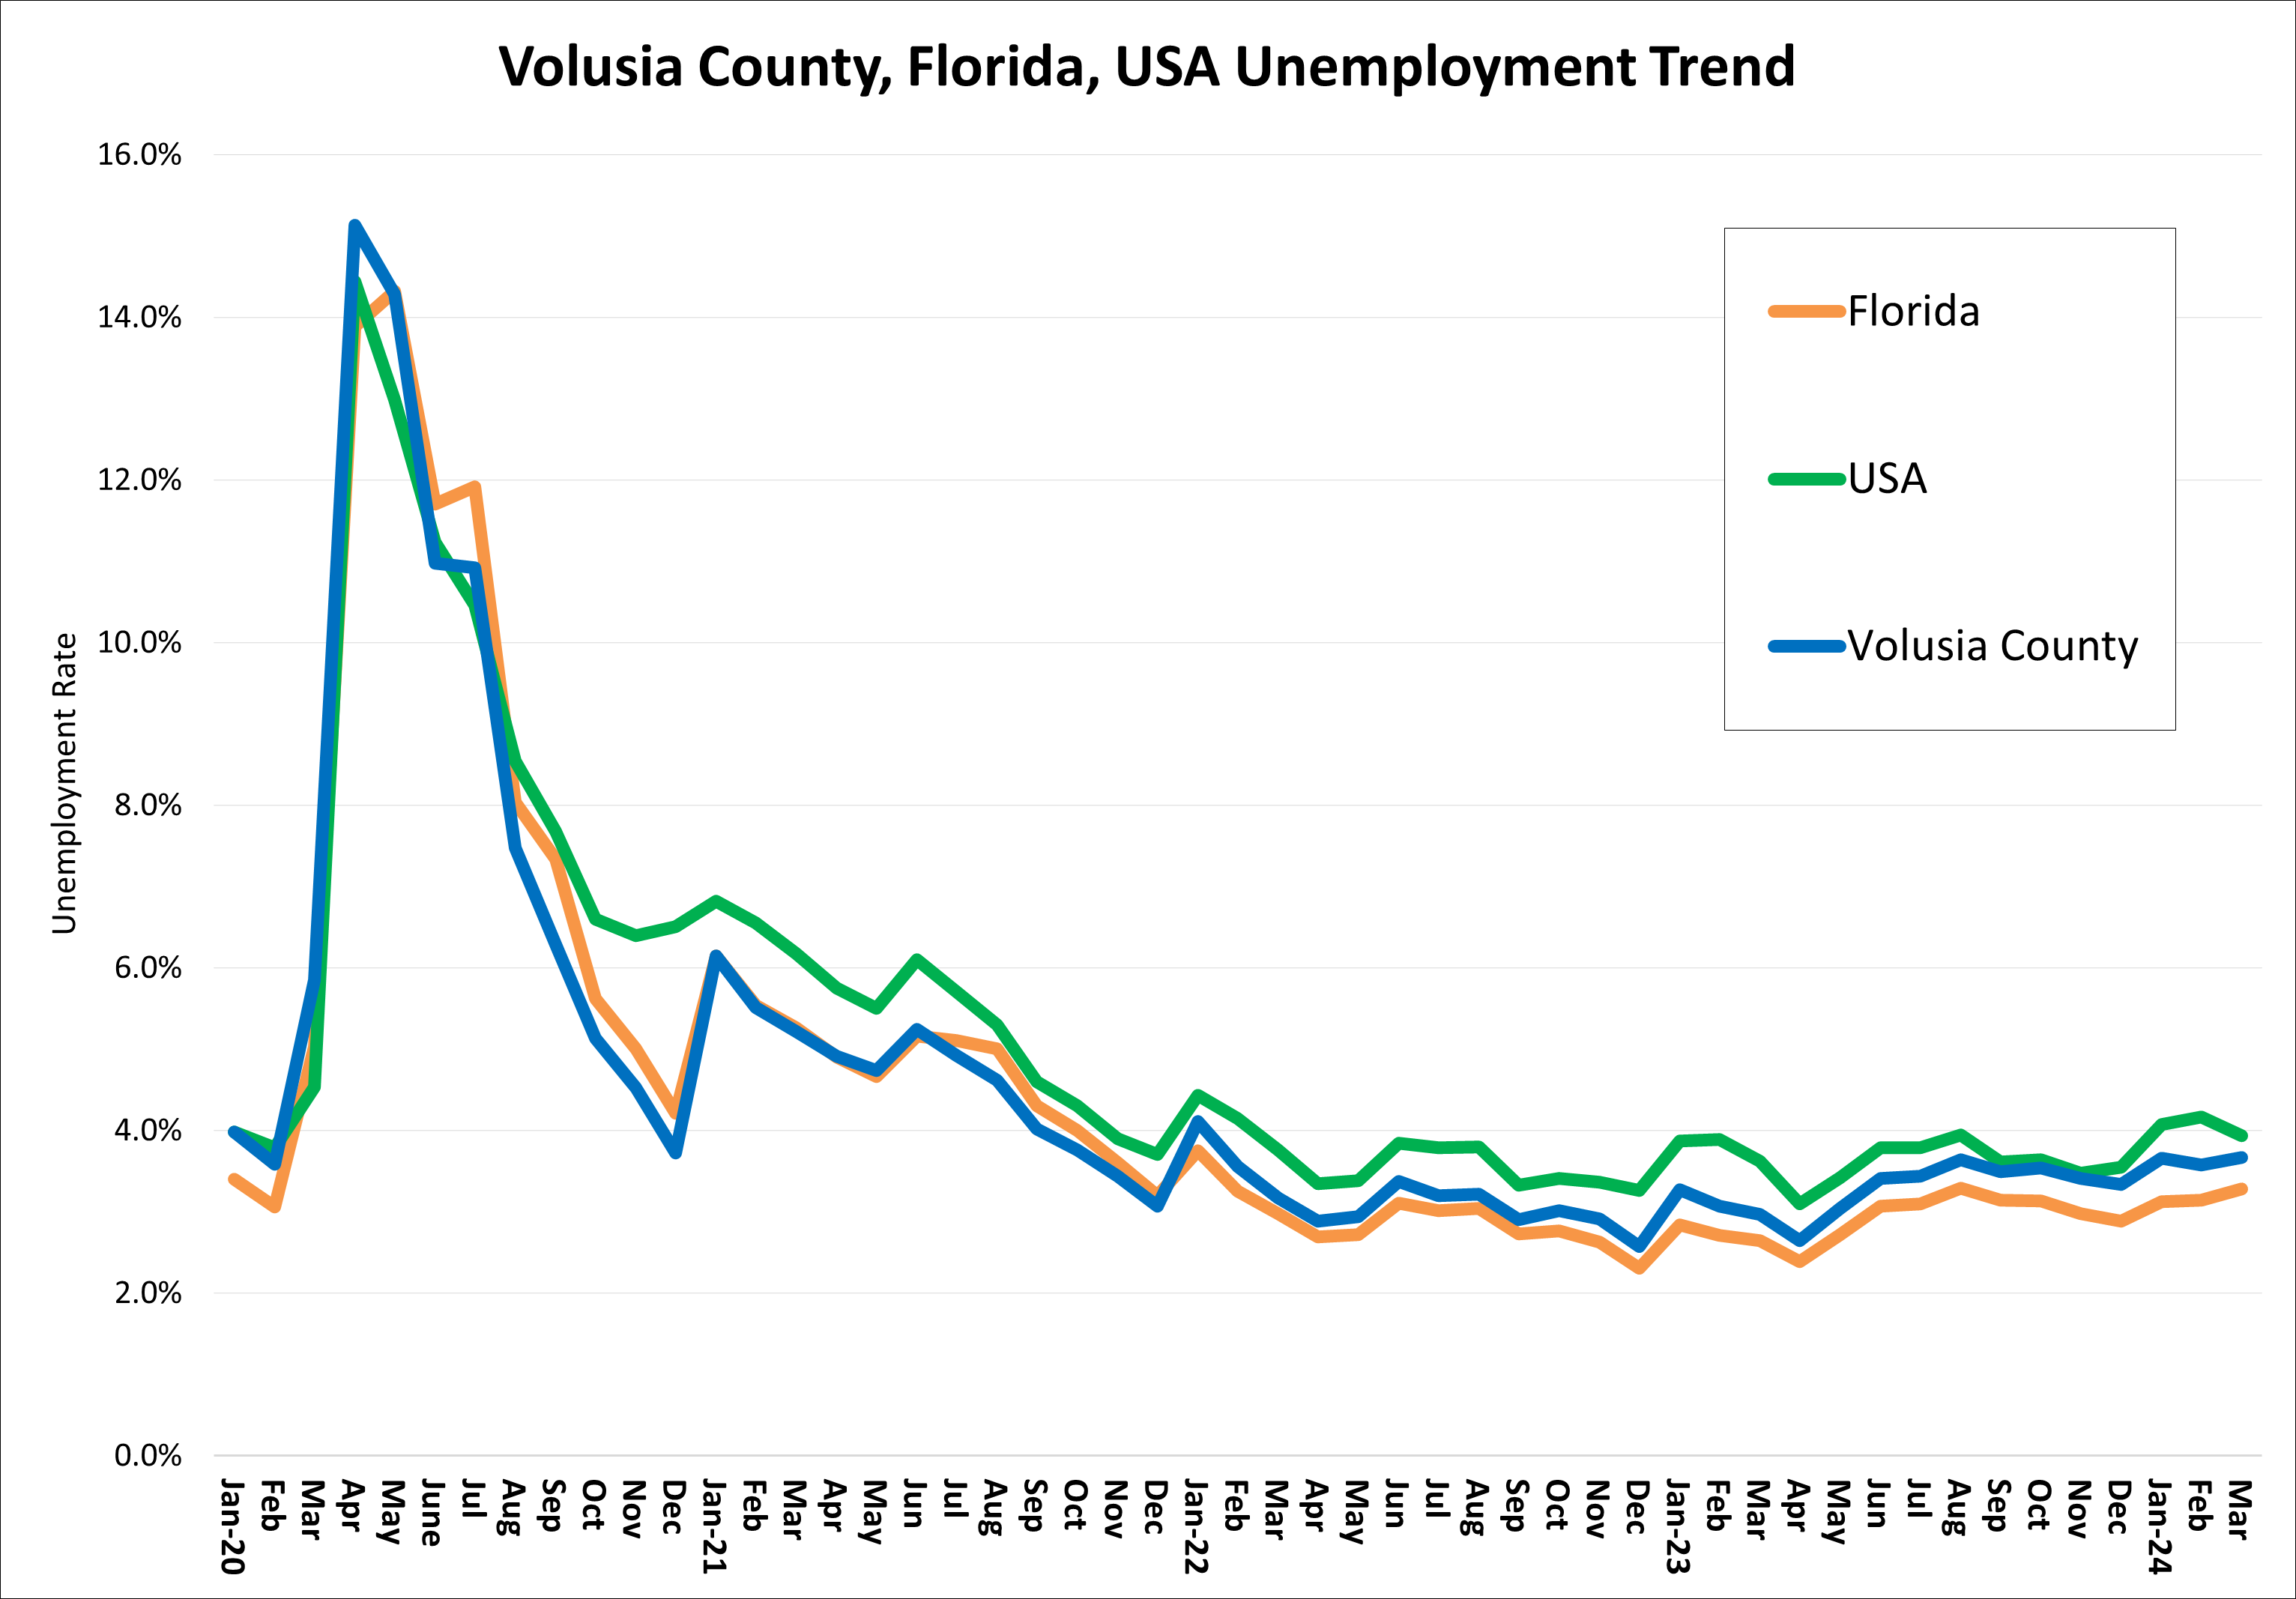
The chart shows the unemployment rate trend for Volusia County, Florida, and the US from January 2020 to present. After the impact of COVID and an initial rate of 15.1%, Volusia County's unemployment rate had a steady decrease throughout 2021 and 2022.  The rate remained relatively steady in 2023, averaging 3.3% for Volusia and averaging 3.8% in 2024. The current rate is 4.0% as of March 2025 reduced from Feb. 2025 rate of 4.3%. For March 2025, Florida’s unemployment rate was 3.7% and the U.S. was 4.5%.

Source:  FloridaCommerce, Local Area Unemployment Statistics (LAUS) program.

Area Employment by Major Industry

For a complete overview of area employment and labor statistics, view the "Q" report here.

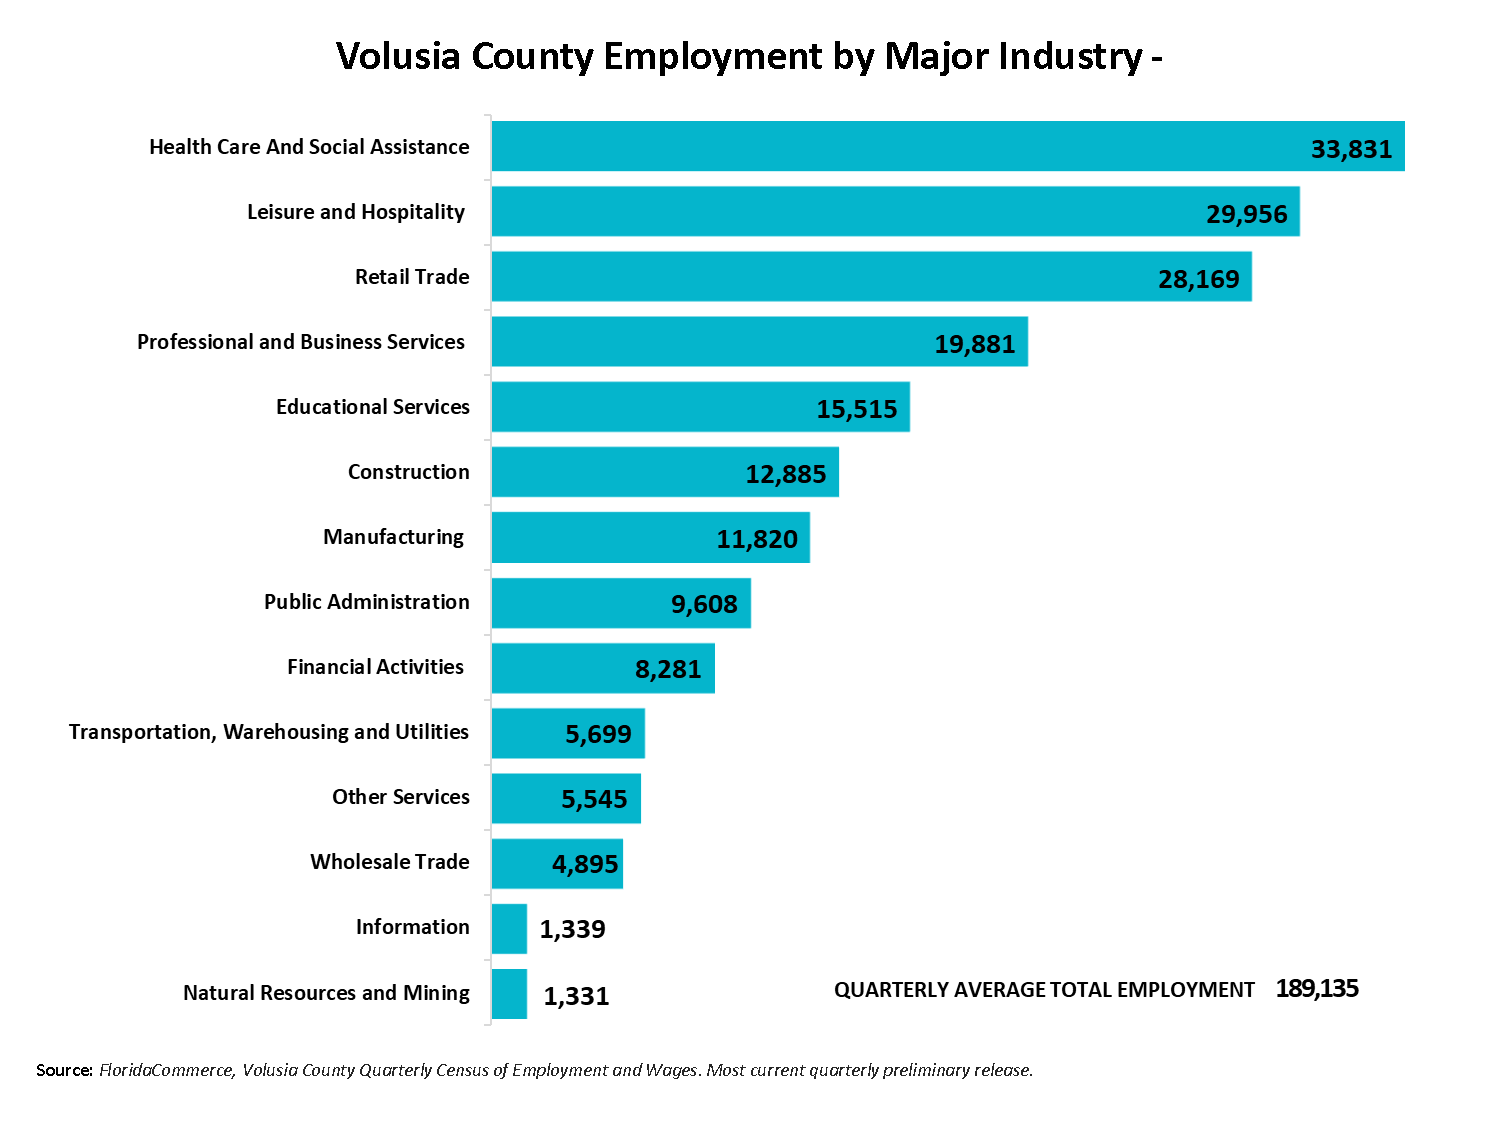
The chart shows the Volusia County employment levels by the major super sector industries for the 3rd quarter of 2023. Health Care and Social Assistance – 32,356, Leisure and Hospitality – 29,564, Retail Trade – 28,034, Professional and Business Services – 19,595, Educational Services – 14,083, Construction – 12,675, Manufacturing – 12,034, Public Administration – 9,377, Financial Activities – 8,288, Transportation, Warehousing and Utilities – 5,654, Other Services – 5,329, Wholesale Trade – 4,594, Information – 1,359, Natural Resources and Mining – 1,338. The quarterly average total employment was 184,759 which is a 2.4% increase over the same period last year in the 3rd quarter of 2023.


Average Workforce Size

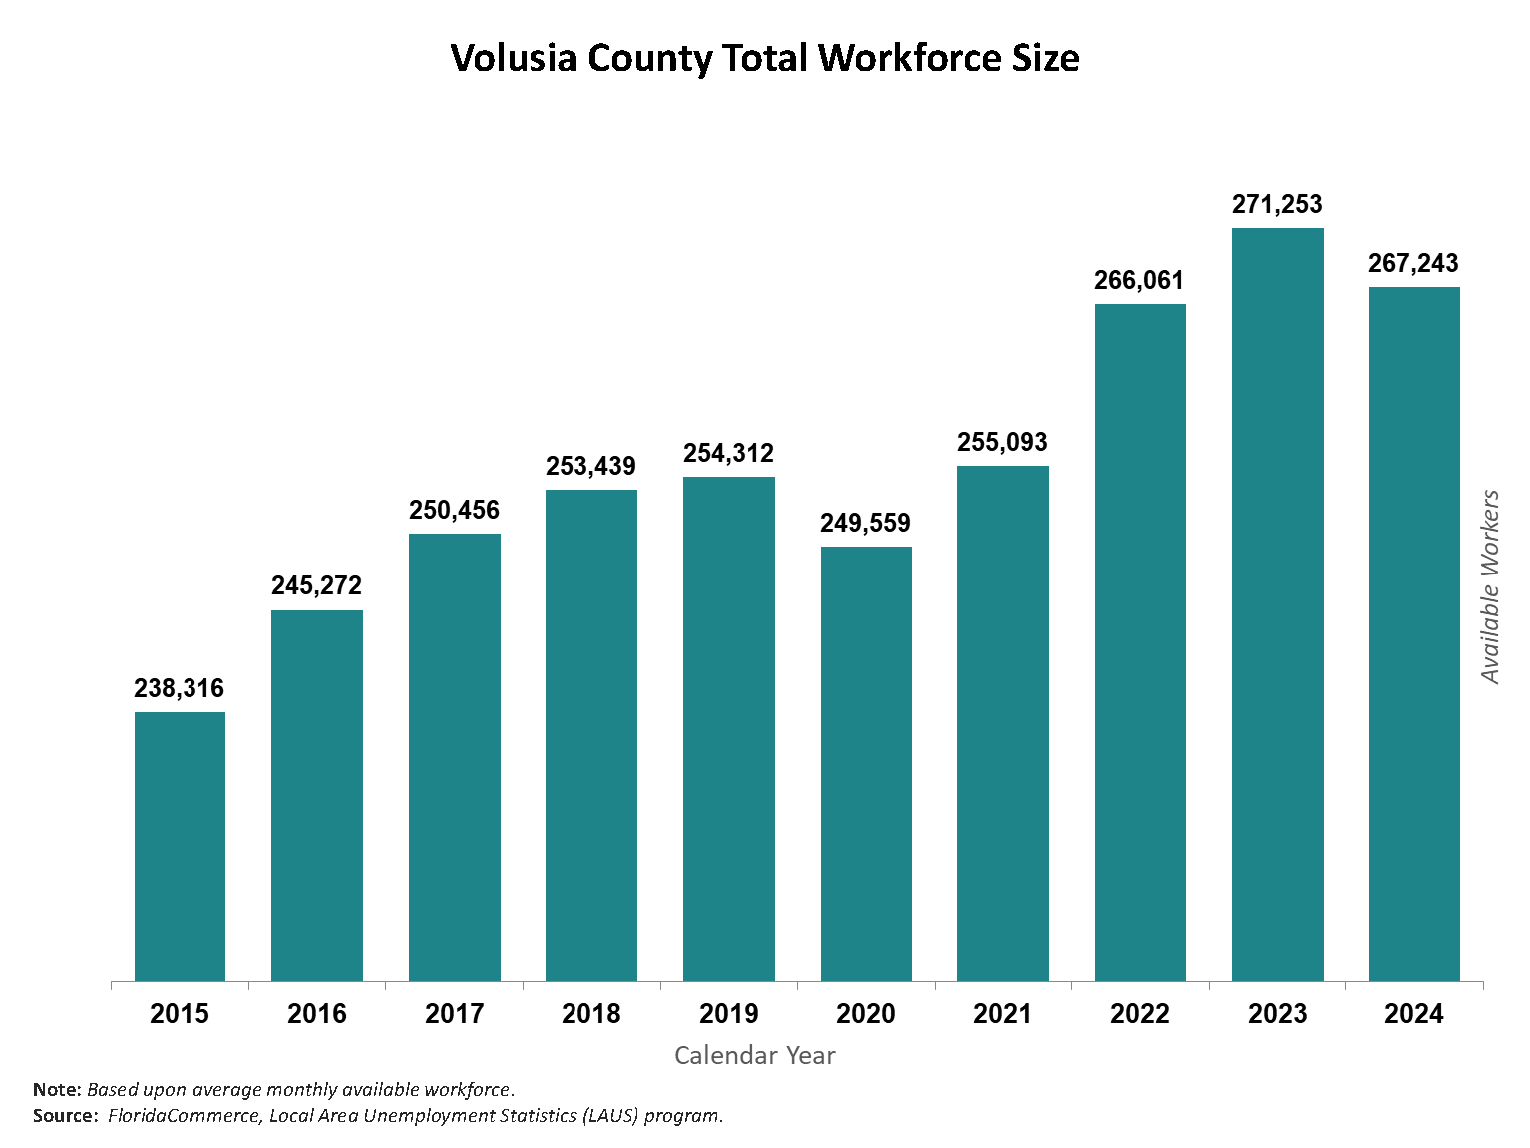
Volusia County available total workforce reached record levels of approximately 271,253 in 2023 and has since reduced by 1.5% to 267,243.

The chart shows Volusia County’s total workforce from 2015 to 2024 based upon the average monthly workforce each year. 2015 – 238,316. 2016 – 245,272. 2017 – 250,450. 2018 – 253,439. 2019 – 254,312. 2020 – 249,559. 2021 – 255,093. 2022 – 266,061. 2023 – 271,253. 2024 – 267,243

Go Back


Average Employment

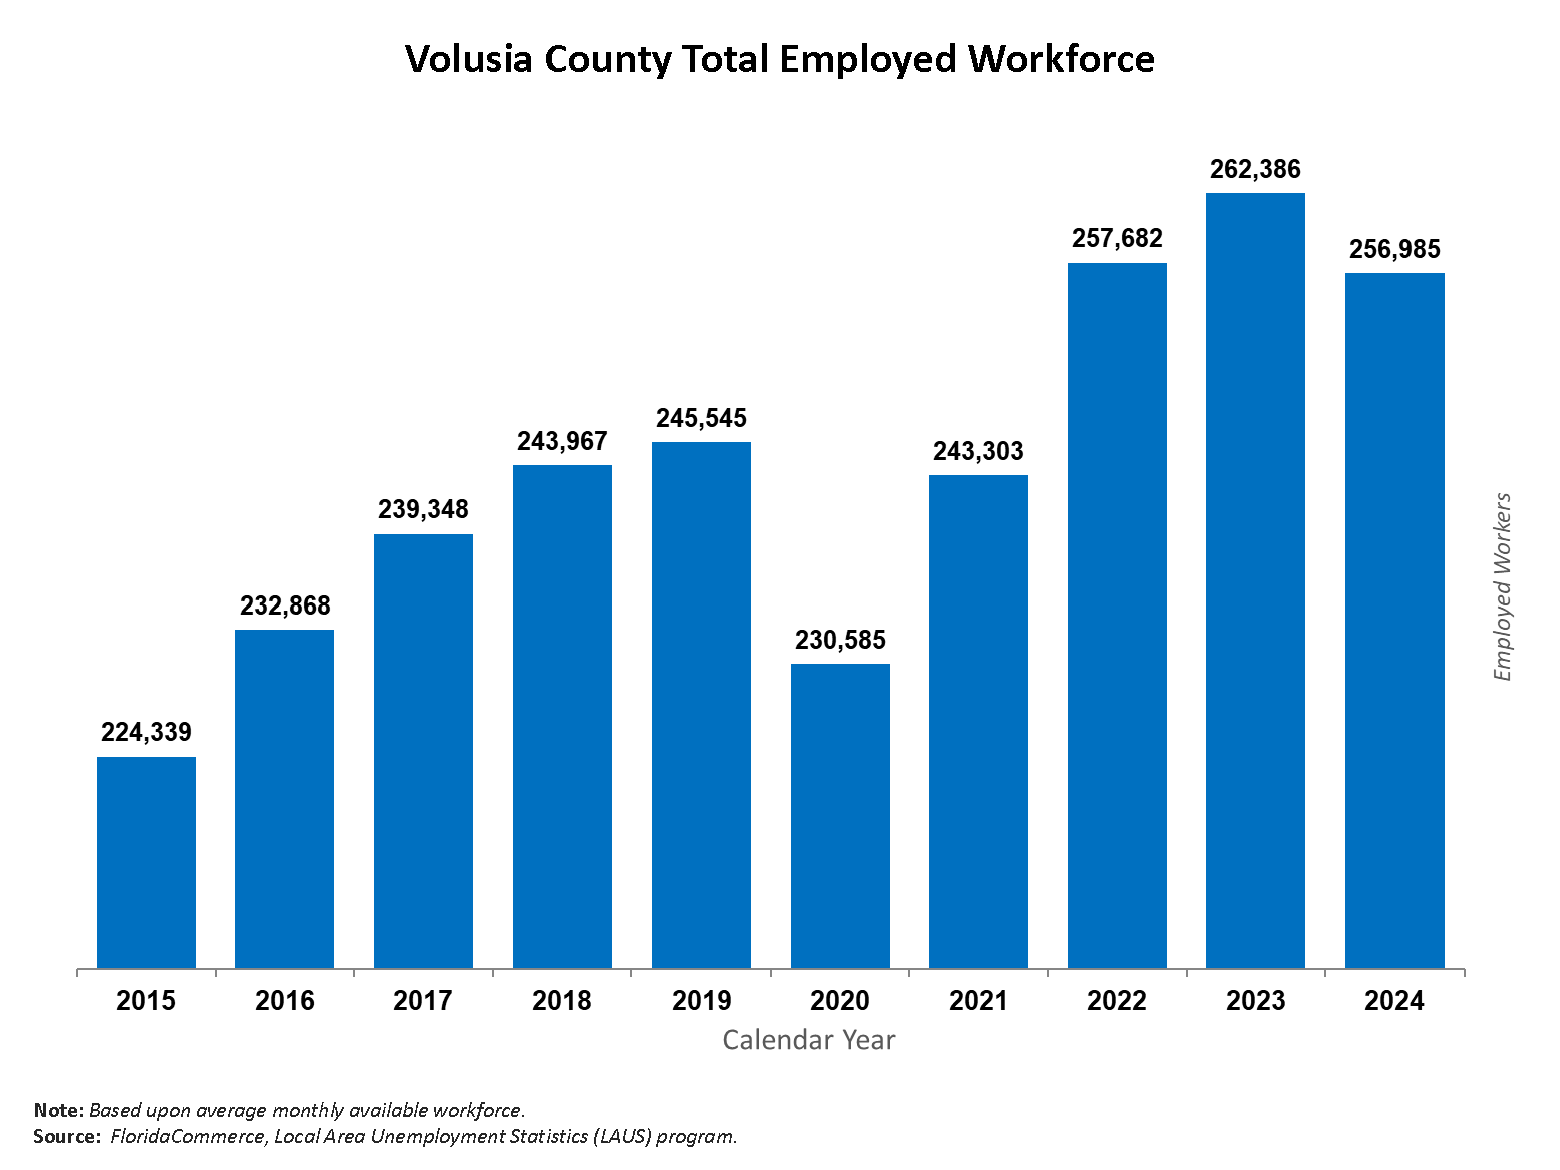
Volusia County total employment workforce reach record levels of approximately 262,386 in 2023, surpassing pre-pandemic levels in 2019, and has since reduced by 2.1% to 256,985.

The chart shows Volusia County’s total employed workforce from 2015 to 2024 based upon the average monthly workforce each year. 2015 – 224,339. 2016 – 232,868. 2017 – 239,348. 2018 – 243,967. 2019 – 245,545. 2020 – 230,585. 2021 – 243,303. 2022 – 257,682. 2023 – 262,386. 2024 – 256,985.

Go Back


Average Unemployment Rate

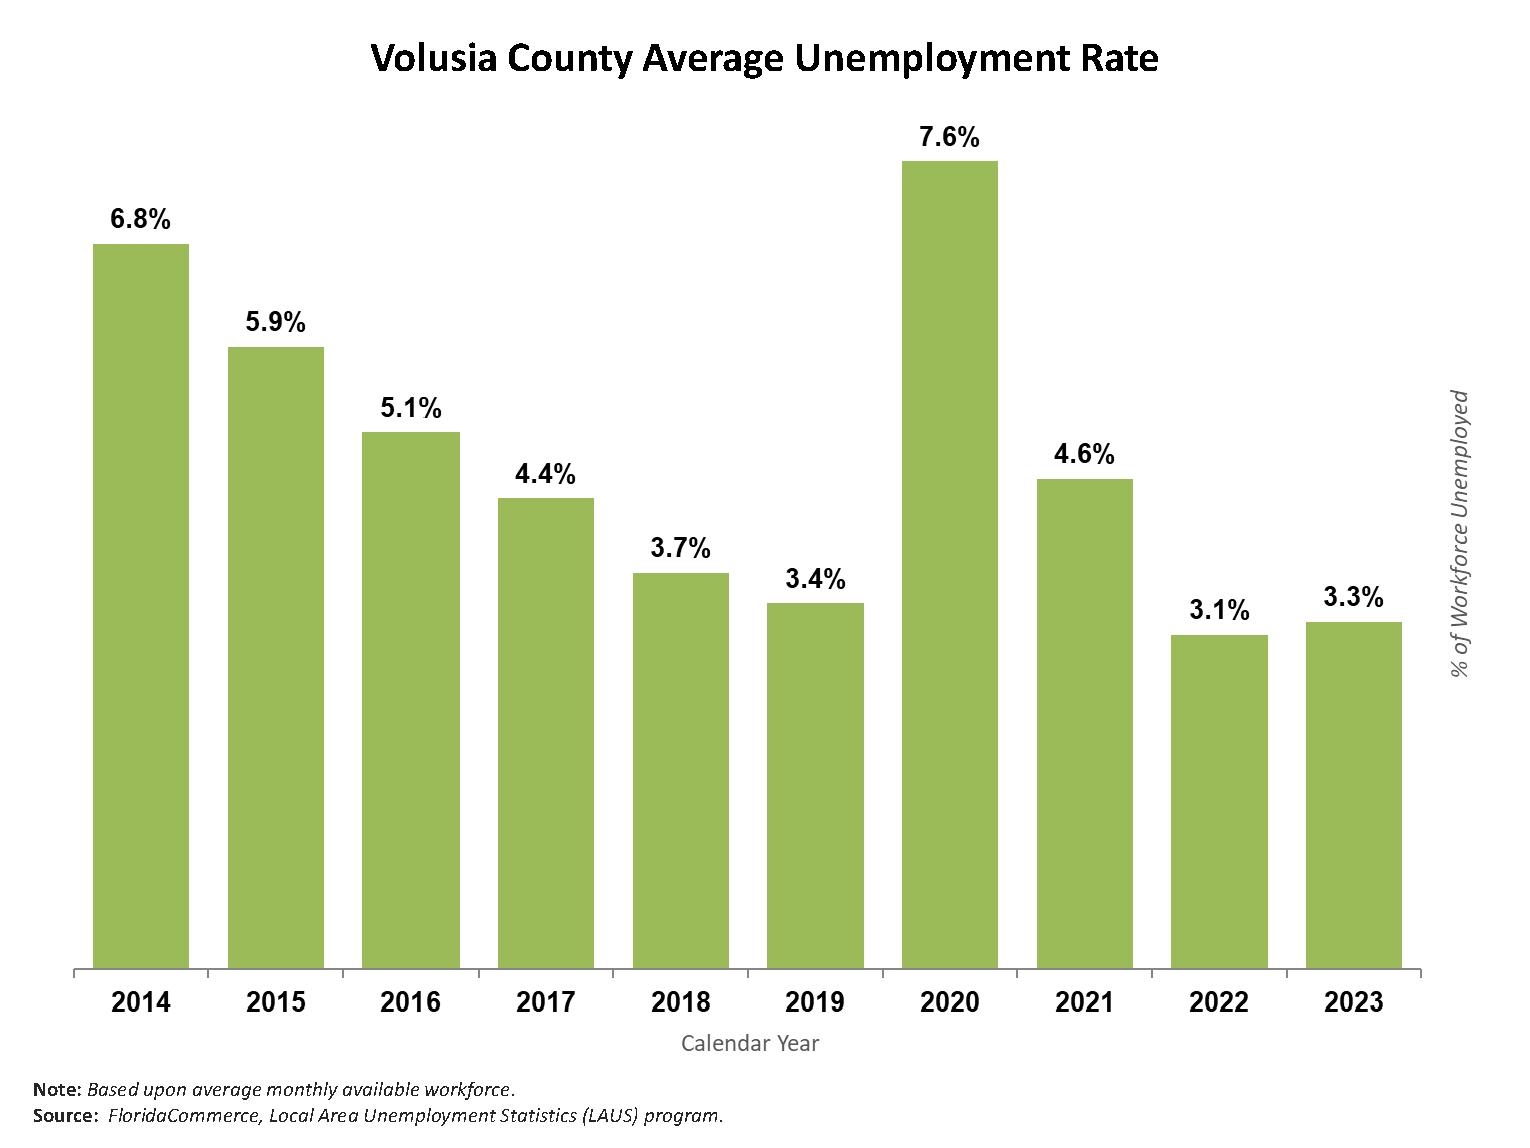
Volusia County unemployment dropped to a average rate of 3.3% in 2023. In 2024, the average rate increased to 3.8%.

The chart shows Volusia County’s average unemployment rate from 2015 to 2024 based upon the average monthly workforce each year. 2015 – 5.9%. 2016 – 5.1%. 2017 – 4.4%. 2018 – 3.7%. 2019 – 3.4%. 2020 – 7.6%. 2021 – 4.6%. 2022 – 3.1%. 2023 – 3.3%. 2024 – 3.8%.

Go Back


2023 Average Annual Wage

Volusia County

$51,246

Florida

$66,288

U.S. 

$72,608

Source:  FloridaCommerce, 2023 Quarterly Census of Employment and Wages program, released February 2025.

Private Average Annual Wage

Volusia County wages are reasonable and able to support a quality of life that continues to draw people to our communities.

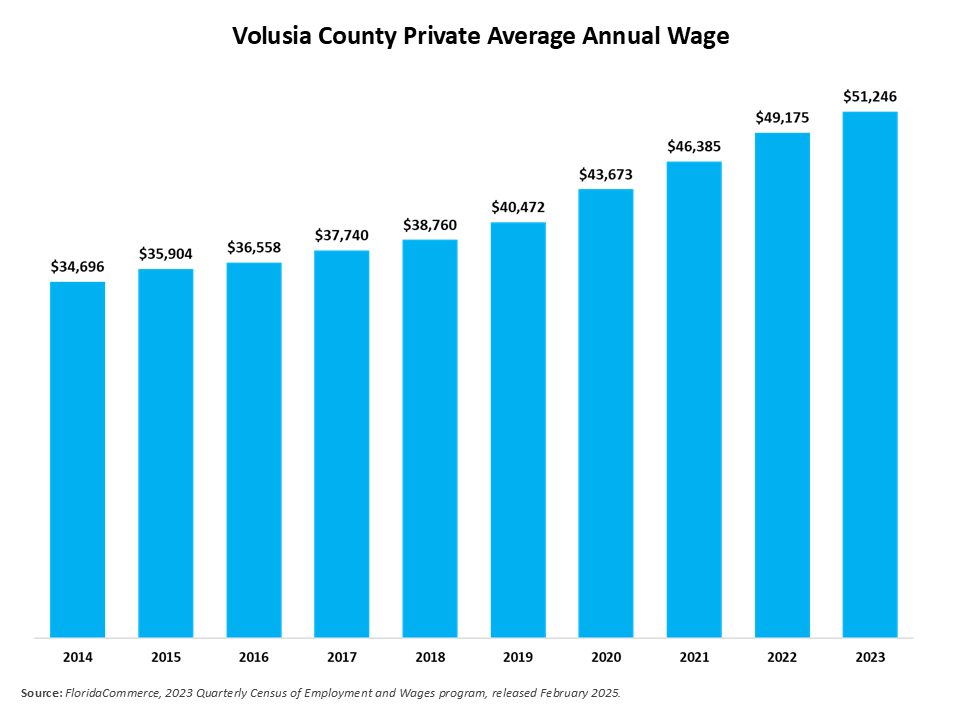
The chart shows Volusia County’s average annual wage trend from 2014 to 2023 and sustained a 10-year average percent increase of 4.13%. Wages increased 4.2% from 2022 to 2023. Average wage by year beginning with 2014 wage was $34,696. 2015 - $35,904. 2016 - $36,558. 2017 - $37,740. 2018 - $38,760. 2019 - $40,472. 2020 - $43,673. 2021 - $46,385. 2022 - $49,175; and 2023 - $51,246.

Go Back


Regional Average Annual Wage Comparison

Volusia County wages are regionally competitive allowing businesses to attract the talent they need.

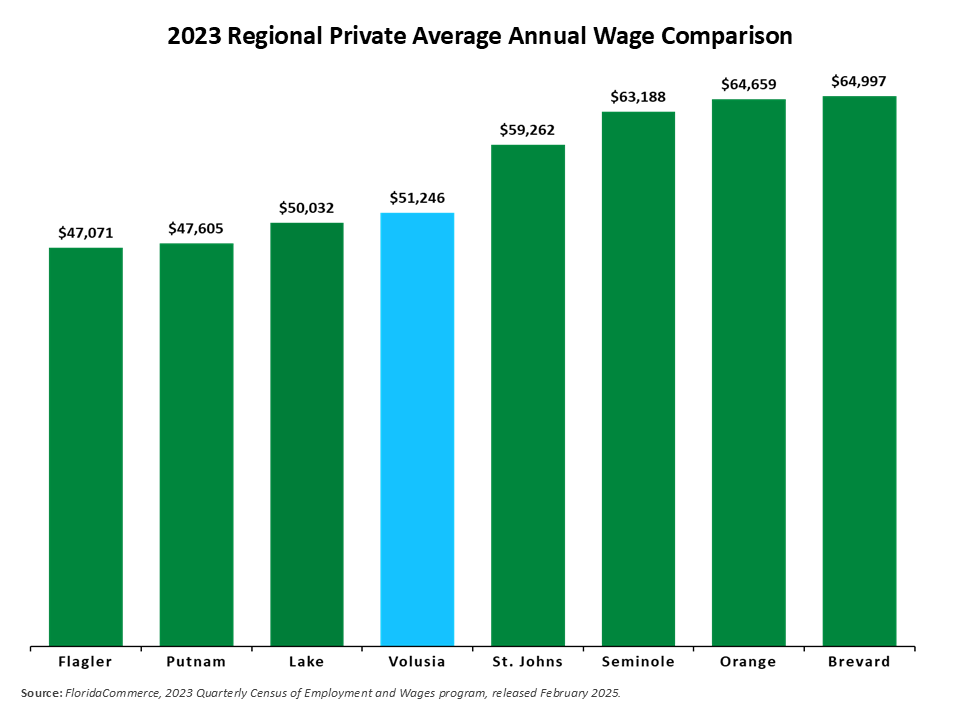
Volusia County ranks 31st out of 67 counties for the private average annual wage. The chart shows the regional counties 2023 private industry average annual wages for comparison to Volusia County.  Flagler - $47,071 an increase of 5.1% from 2022. Putnam - $47,605 increase of 3.4%. Lake - $50,032, increase of 3.7%. Volusia $51,246, increase of 4.2%. St. Johns - $59,262 increase of 5.0%. Seminole - $63,188 increase of 4.2%. Orange - $64,659 increase of 4.3%. Brevard $64,997 increase of 5.2%.

Go Back


Private Industry Average Wage by Super Sector

Volusia County wages are appropriate for your business and the industry sector you compete in.

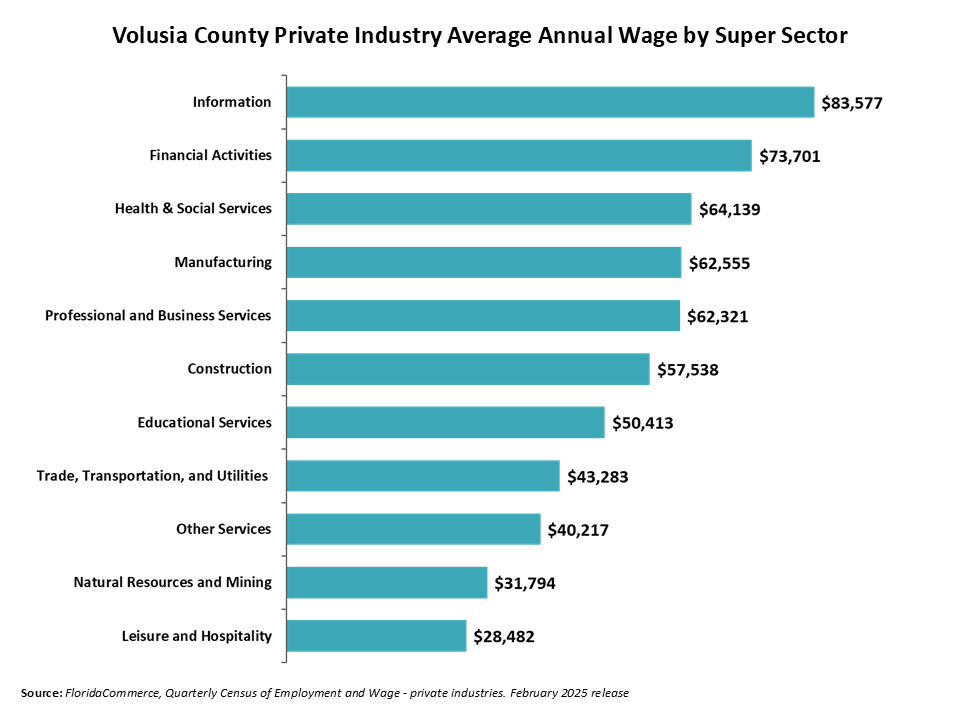
The chart shows the 2023 Volusia County Private Industry Average Annual Wage by Super Sector. The highest average wage was in the Information sector at $83,577. Financial Activities $73,701. Health & Social Services $64,139. Manufacturing $62,555. Professional and Business Services $62,321. Construction $57,538. Educational Services $50,413. Trade, Transportation, and Utilities $43,283. Other Services $40,217. Natural Resources and Mining $31,794. Leisure and Hospitality $28,482.

Go Back

How can we help?

Talk to one of our local experts about your business needs.

Contact Us
Volusia County Icon